
Overview
Our infographic dashboards offer a snapshot of the key data EngineeringUK holds on a given topic. This dashboard focuses on STEM in school. Interest and confidence in school science is going down. Hands-on practicals are declining, despite being the main motivator for young people. This dashboard includes young people’s views on science and computing in the classroom, and explores the declining practical rate. It also looks at young people’s and teacher’s engagement with STEM outreach activities.
Key findings
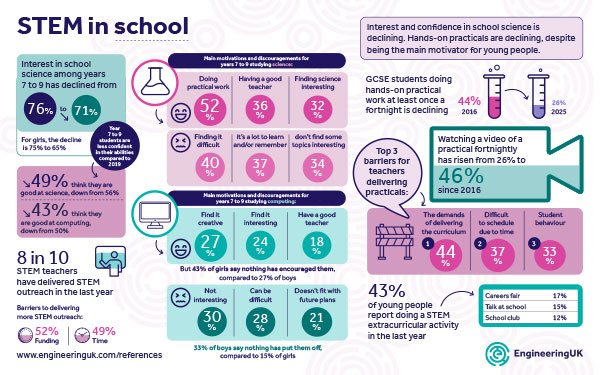
- Interest in school science among years 7 to 9 has declined from 76% to 71%. For girls, the decline went from 75% to 65%
- 8 in 10 STEM teachers have delivered STEM outreach in the last year
- Barriers to delivering more STEM outreach: 52% funding and 49% time
- GCSE students doing hands-on practical work at least once a fortnight is down – from 44% in 2016 to 26% in 2023
- Watching a video of a practical fortnightly has risen from 26% to 46% since 2016
- Top 3 barriers for teachers delivering practicals:
- The demands of delivering the curriculum 44%
- Difficult to schedule due to time 37%
- Student behaviour 33%
STEM in school infographic dashboard
Who this is for
- Careers leads
- Employers
- Policymakers
- PEIs
- Researchers
- STEM outreach organisations
- Teachers

More infographics
We have lots of other infographic dashboards on industry data and our programmes to support your work
Want to inspire the next generation into engineering?
By aligning your outreach with national campaigns such as Tomorrow’s Engineers Week or National Careers Week, you can increase cut through and your impact. Find all the national campaigns in our events calendar and boost your outreach.


