
Overview
Our infographic dashboards offer a snapshot of the key data EngineeringUK holds on a given topic. This dashboard focuses on diversity in engineering and technology. The engineering and technology workforce is not representative of the wider working population. We need to attract more young people from all backgrounds, especially girls, to create the diverse workforce needed for engineering and technology to thrive. This dashboard looks at the differences for different demographics across the workforce and educational pathways. It also looks at young people’s perceptions of STEM at school and of STEM careers.
Key findings
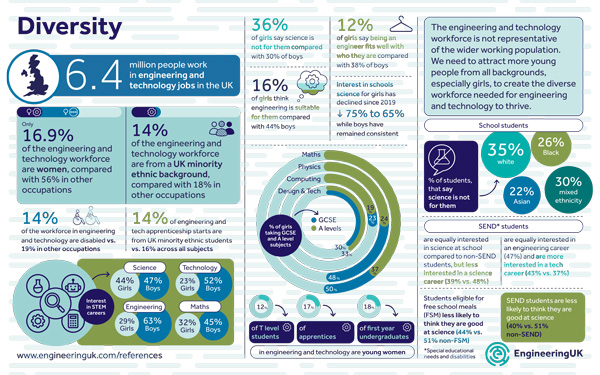
- Only 16.9% of the engineering and technology workforce are women, compared with 56% in other occupations
- 14% of the engineering and technology workforce are from a UK minority ethnic background, compared with 18% in other occupations
- 14% of the workforce in engineering and technology are disabled, versus 19% in other occupations
- SEND students are less likely to think they are good at science (40% vs 51% non-SEND)
- SEND students are equally interested in an engineering career (47%) and are more interested in a tech career (43% vs 37%)
- Young women and girls are underrepresented in all pathways into engineering and technology.
Diversity infographic dashboard
Who this is for
- Careers leads
- Employers
- Policymakers
- PEIs
- Researchers
- STEM outreach organisations
- Teachers

More infographics
We have lots of other infographic dashboards on industry data and our programmes to support your work
Want to help increase the diversity of the future workforce?
By aligning your outreach with national campaigns such as International Women’s Day or Ada Lovelace Day you can increase your cut through and your impact. Find all the national campaigns in our events calendar and help inspire the next generation.


